The effects of COVID over the last year have been severe, with unemployment and mental health being two of the major side effects. Although the battle to contain the spread is still front of mind in most countries, many places are starting to see the light at the end of the tunnel. Australia has gone from a daily peak of 700 new cases in August 2020 to an average of 6 cases after 5 months. Although each State in Australia has had differing intensities of cases and lockdown, the country overall has managed to combat peaks and transition into a COVID normal way of life. Through this transition we can see the changes that have already occurred and start to examine how the future of cities may look. Focusing on workers we can analyse how COVID has affected office and hospitality locations, migration out of cities and tourism’s effect on employment rates and locations.
Every December we perform an update on our Australian worker location dataset. This geodata provides a count of workers at multiple geographic boundaries (ABS). The count was calculated using three separate sets of data with weighted percentages depending on correlation strength:
- Land Use
- Commercial Real Estate
- Points of Interest (POI)
Analysing this data at a higher scale and against past updates we can see the shift to working from home (WFH) and determine areas worst affected by COVID.
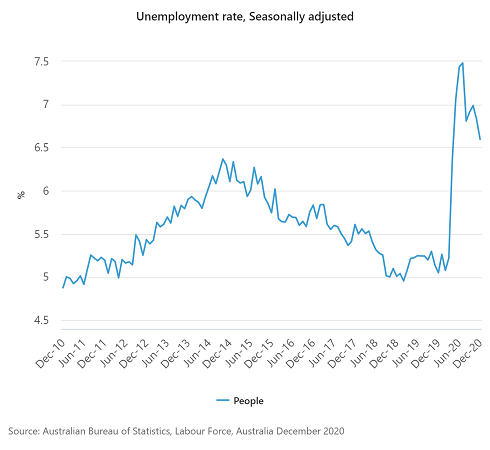
COVID has had a significant impact on unemployment in Australia. In January 2020, before the pandemic, the unemployment rate was 5.2%. Having reached a peak of 7.5% in August 2020 (during the height of the pandemic in Australia), it is now at 6.6%.
Using our workers data, we can explore the areas that have been affected by unemployment the most and compare across states.
Job losses across states:
New South Wales (NSW), Victoria (VIC) and Queensland (QLD) have always had the largest worker populations, with most of the country’s population and metropolitan cities within these areas. Although these states still have the largest overall worker populations in 2021, when comparing the changes over the last few years and the effect of COVID it is evident these states were the hardest hit.
Using Geolytix Worker Data (updated in December 2020), we can see that NSW had an increase of 144,000 workers in 2019; when COVID hit, this decreased by 20,000. Other states were impacted heavily too; VIC lost 15,000 workers and QLD lost 16,000.
Melbourne (VIC) and Sydney (NSW) are the largest cities in Australia with many workers - especially in corporate jobs - so a large decrease through COVID was to be expected. What is interesting however, is the impact on QLD. Whilst having a much smaller population than NSW, at 3,000,000 less, the state lost only 4,000 fewer workers than NSW. This highlights how different industries have been affected by COVID; QLD has a huge dependency on tourism, with many of the jobs in the area linked to this industry, and we know that the tourism industry has taken a huge hit from lockdowns, border closures and government restrictions.
Australia has had a large decrease in worker counts overall, with each state having different industries and areas affected by COVID. However, we can see the significant effect on tourism, with many of these jobs lost from both local and international border closures. It will be interesting to see the effect on employment when state borders are open and then again when international flights resume, especially in QLD.
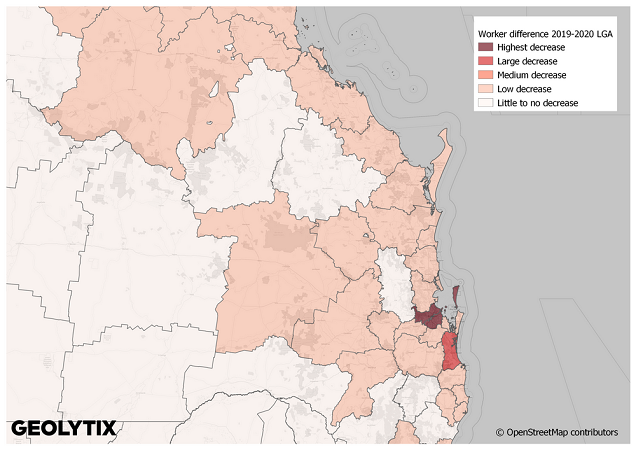
Local Government Areas (LGA):
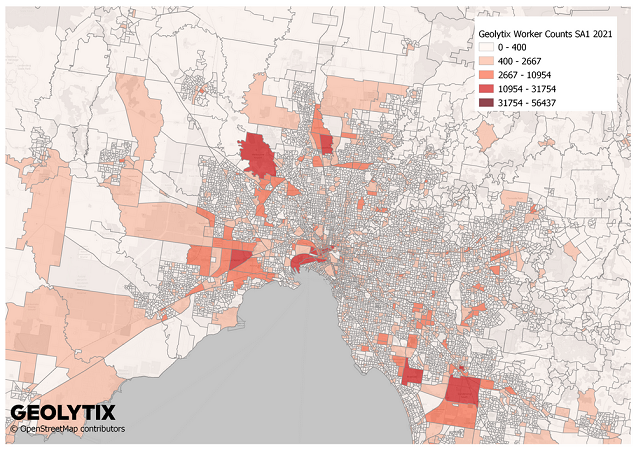
Worker counts are provided at mesh block and SA1 level, but when you aggregate these counts to larger council areas you can see the patterns of mobility on workers in 2021.
LGA locations that had the largest growth in 2019-2020 were Brisbane, Sydney, Melbourne, Gold Coast, Parramatta, Hume and Adelaide. The growth ranged from 20,000- 35,000 workers and all areas were classified as ‘city’ types (according to ABS). In 2020-2021 however, the largest growth was seen in Willoughby, Mount Magnet, Vincent, Moorabool, Carrathool, Mosman Park and Kent. The growth ranged from 3,000-8,000 workers and classifications ranged from Area, Shire, City and Town. This analysis alone shows the movement of people and workers to more rural/residential areas and a shift away from large cities. Working from home was the new normal in 2020, with offices, public transport and cities being hotspots for COVID Transmission. These factors along with people shifting from roles in city centre cafes and tourism jobs to neighbourhood supermarkets, online companies and industrial jobs (e.g. postal processing, agriculture), where working is prominently done at home or in outer suburbs, shows the dramatic change in workplace locations and new localisation patterns.
The future of workers in Australia is optimistic, employment numbers are on the rise, some states have opened their borders and case numbers are the lowest they have been since before the pandemic began in 2020. It will be very interesting to compare the worker counts and patterns we are seeing now to 2022, especially with the next Australian Census due to be performed in August 2021. There are however still many factors that could change the course of Australia over the coming months, with an example of Victoria having one new community transition on the 3rdof February, delaying the shift to 75% office capacity.
Will the case fluctuations and forever changing rules prevent many central office locations from recovering, along with the many small businesses that rely on their trade? Or will business move to the suburbs? We are likely to see an increase in retailers and cafes in the suburban locations that are already indicating worker growth; these patterns in Australia are likely to portray spatial changes for cities all over the globe.
Georgina Aucutt, Data Scientist at Geolytix
Photo by Nick Jones on Unsplash