INTRODUCTION
This week saw a major milestone in the UK… finally we can have a pint indoors – no more sitting under umbrellas sheltering our pints from the very timely British rain.
We thought it would be interesting to see the impact of the first pint related milestone – April 12th, the day pubs and restaurants were able to open for outdoor serving; a date I imagine will never be forgotten.
Using Unacast mobile ping data, we have looked at the movement of unique mobile devices around our food and beverage (f+b) hubs across the UK, setting 2019 data as a base marker for an ‘average year’, January-April 2021 data as ‘lockdown’ and then April 12th-May 11th to gain an understanding of the impact of outdoor seating.
Our f+b hubs were all created by us, making for a very unique data set. The hubs cover locally recognised ‘destination’ eating and drinking places across cities, large towns and tourist towns and were created by determining which are on the same or adjacent streets. We then pinpointed areas of a high concentration of these establishments. The final stage was a manual review, set to categorise the type of hub and whether it is predominantly eating, drinking or clubbing.
AN ANALYSIS OF LONDON
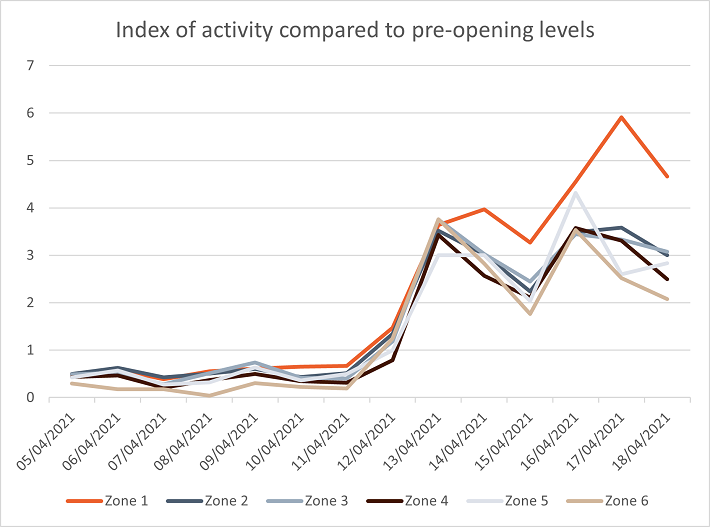
This first graph, which looks at Activity Levels ranging from 1 week before to 1 week after the opening of outdoor seating, indicates that the easing of restrictions has had a significant impact on all 6 London zones (compared to lockdown activity levels). Zone 1 for instance has seen an almost 6-fold increase in activity movements between the 5th and 18th of April.
ZONE ANALYSIS
We also thought it was important to look at how each zone has ‘bounced back’ in relation to both ‘lockdown’ (January-April 2021) and ‘pre-covid’ (2019) levels.
Analysing by individual zones it is not surprising that Zone 1 is still to bounce back to its 2019 levels, as workers are yet to return to offices, making that daily commute into central London in the numbers experienced in 2019.
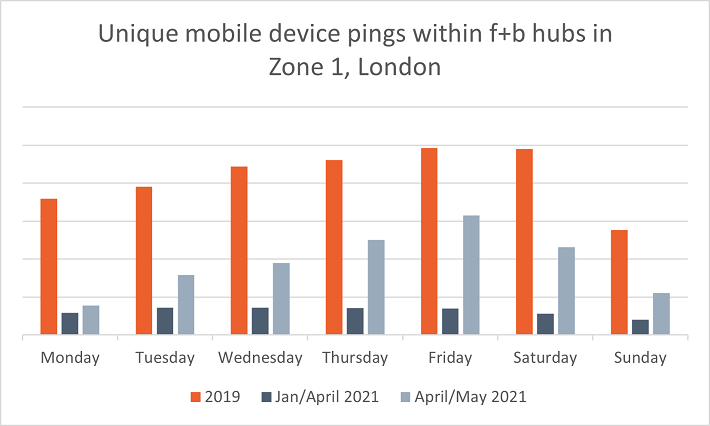
I think it is rather important to remember that the 2019 activity levels in Zone 1 are exceptionally higher than in Zones 2-6, and so activity levels in central London did reduce significantly. Encouragingly, Zone 1 experienced the highest activity level increase compared to lockdown levels, with Fridays and Saturdays seeing a 352% and 317% increase, respectively.
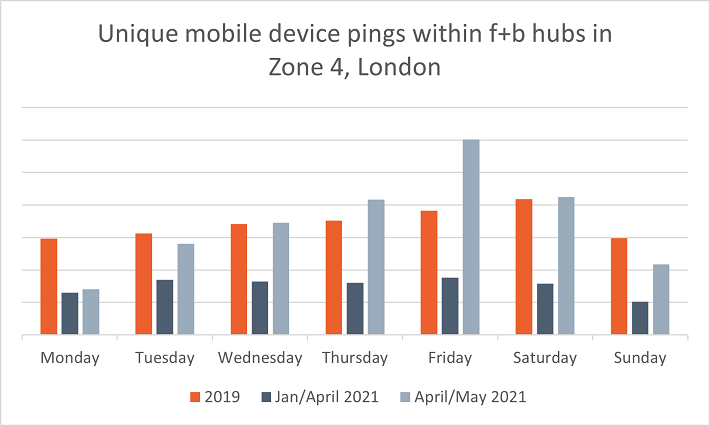
We expected to see the outer Zones would feel the positive impacts of outdoor eating slightly more; as people are working from home, its likely that they will venture into, and explore, surrounding areas to eat and drink, rather than travel into central London to do so.
F+b hubs in Zone 4 are recovering very well, with Wednesday-Saturday experiencing an increase in activity level above those seen in 2019, pre-COVID.
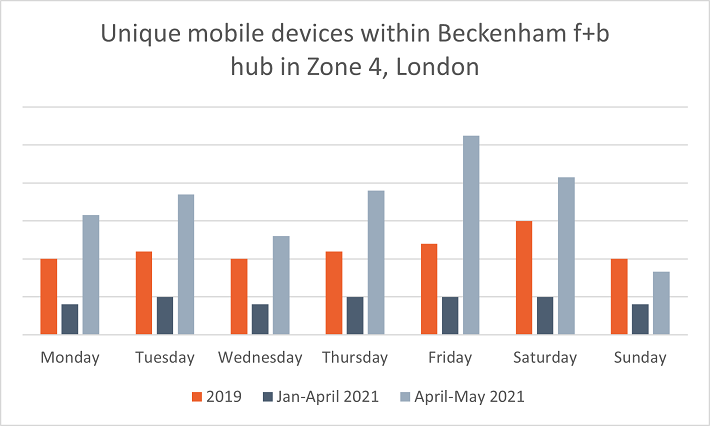
Looking further into the f+b hubs within Zone 4, Beckenham’s activity levels have exceeded 2019 levels on all days bar Sundays. Of note is the increase seen on Fridays reaching 119% of 2019 levels.
BOROUGH ANALYSIS
We also analysed at a Borough level, and it is interesting to see how each of the Boroughs have recovered – compared to both lockdown and 2019 activity levels.
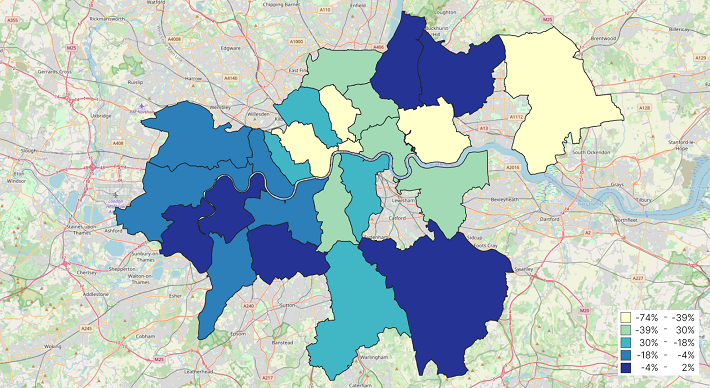
The maps highlight there is certainly impressive recovery across London; whilst central London is still struggling to recover to 2019 (pre-COVID) activity levels, they have bounced back the most compared to lockdown activity levels. This indicates that people are returning to central London, either slowly heading back into the office or venturing in for some social drinks with friends – even through the rain! Only the Borough of Havering is yet to reach the average weekly activity levels seen during lockdown – however, Tuesdays and Thursday-Saturday were above the lockdown average (by up to 67% on Thursdays!).
The outer Borough’s however are where we are seeing the most recovery compared to 2019 activity levels, with even 6 Boroughs being only 4% off pre-covid activity, at most!
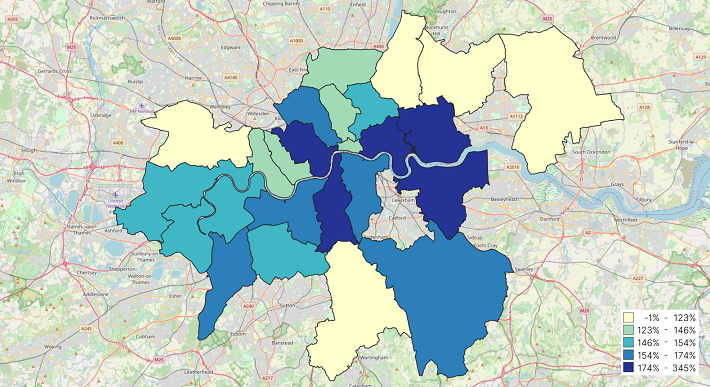
RECOVERY IN COMPARISON TO LOCKDOWN
When looking at the recovery compared to lockdown (January-April 2021) activity levels, the Borough of Westminster takes top spot. With the highest number of f+b hubs (totalling 495 eating, drinking and nightclub establishments), the opening of outdoor dining has led to an average 273% increase in activity, compared to lockdown.
We should mention that although the Borough of Newham experienced an average of 345%increase in activity, we decided to remove this borough from the top spot as these results are likely due to Westfield Shopping Centre – whilst fantastic, we are interested in looking at the impact of food and beverage establishments!
It did surprise us that activity levels on a Sunday in Westminster saw a 243% increase compared to lockdown levels; nowhere near beating the increases seen on a Friday and Saturday (471%and 433% respectively), it’s a huge difference compared to Monday’s (which have only experienced a 69% increase on lockdown activity levels).
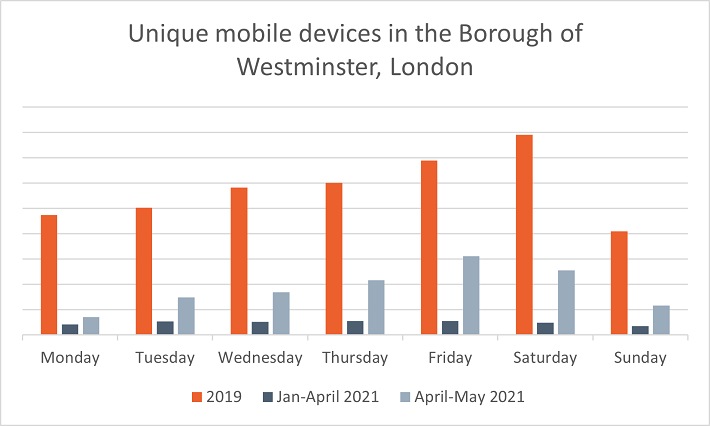
Recovering activity levels have been low on Mondays across all the Boroughs, and we believe this could be due to the introduction of the hybrid week; flexible working could mean that Mondays are no longer being spent in the office which explains a reduction in central London. Again similar supressed activity in the suburban Boroughs are also being seen on Monday’s and this could be as people are having a ‘relaxed’ day after a weekend of socialising.
Within the Westminster Borough itself, individual f+b hubs stand out. Leicester Square, with the highest number of nightclubs; Soho, with the highest number of drinking establishments; and China town, with the highest number of eating establishments, have all experienced an increase in activity levels, as expected.
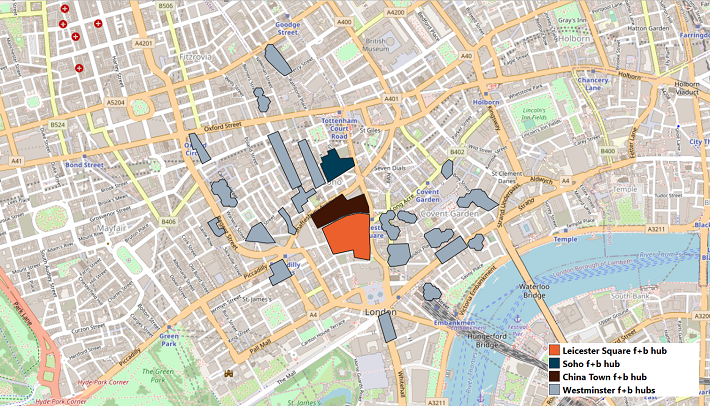
Again, a similar pattern emerges, with Fridays and Saturdays remaining the busiest days across the week, yet Sundays saw a dramatic increase in activity levels. Leicester Square saw a 675% increase on activity levels on Sunday’s compared to lockdown, Soho saw a 267% and China Town a 510%increase.
A shoutout must be given to Friday nights in Soho however – with a whopping 850%increase on activity levels compared to lockdown, I think this could be the place to go for a few drinks to celebrate the weekend!
RECOVERY IN COMPARISON TO PRE-COVID
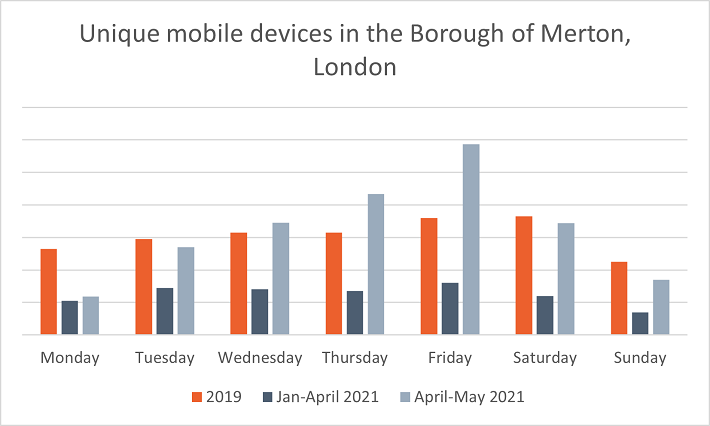
The Borough of Merton caught our eye as it is now experiencing a higher activity level compared to 2019…a round of applause for Merton!
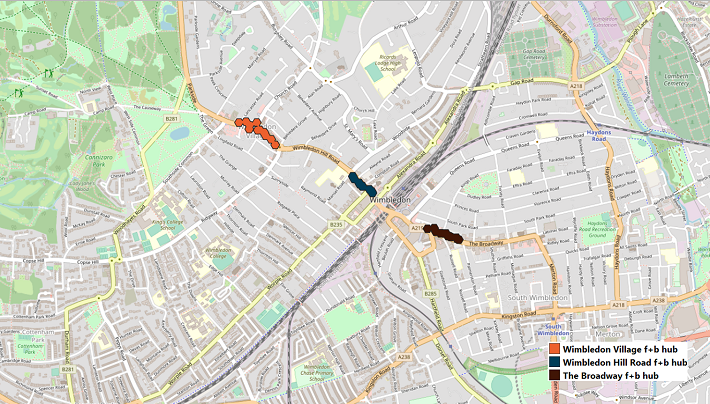
Of all three f+b hubs in Merton, Wimbledon Village has recovered the most significantly, with all days bar Monday exceeding 2019 activity levels. Whether this is down to people exploring around their local areas after work and on the weekends, Merton having a high density of residential areas or a new outdoor venue, maybe Merton is the new place to be! We did read that StreetEat pop-up festival launched in Wimbledon Park on May 20th, so we expect to see an even larger increase in activity in Merton over the next five weeks.
Chris Storey & Kate McGoldrick, Data Scientist and Communications Officer at Geolytix
Photo by Zach Rowlandson on Unsplash